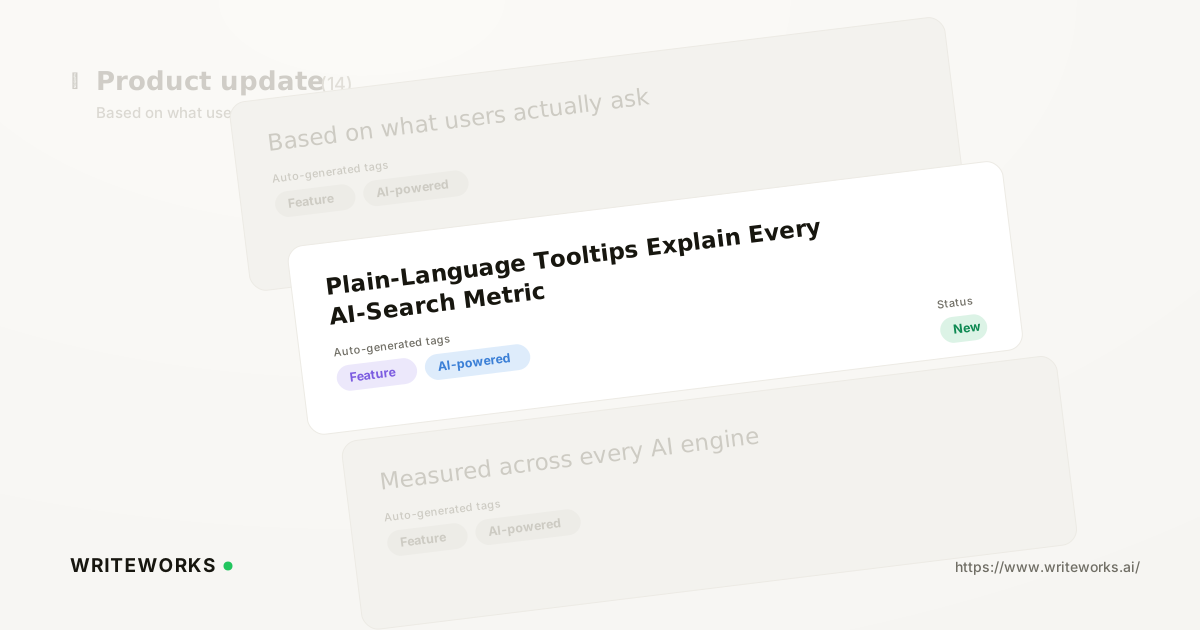
In short: WriteWorks has added plain-language tooltips to the metrics across analytics, so hovering a small (i) icon returns a jargon-free explanation of what that number measures. The same treatment now covers the jargon-heavy items in the sidebar navigation, and every definition comes from one shared glossary. It's aimed at anyone reading AI-search reporting - from analysts who live in the dashboards to the executives and clients who only see the summary.
AI-search metrics are genuinely new. Terms like share of voice, citation share and query fan-out don't yet have a single settled definition across the industry, which means people either guess at what a number represents or keep a glossary open in another tab. Neither is a good basis for a decision.
What are plain-language metric tooltips?
Plain-language metric tooltips are short, jargon-free definitions attached to every metric in WriteWorks analytics, shown when you hover the (i) icon beside the metric name. Instead of interpreting a label from context, you get a sentence that states what the number actually measures.
The same idea extends to navigation. Sidebar items with technical names now carry hover hints, so you can tell what a section contains before you open it.
How the tooltips work
A single shared glossary powers every tooltip in the product. Each metric definition is written once, then surfaced wherever that metric appears - in analytics views and in the navigation - so the wording stays consistent from page to page.
In practice that means three things:
- One definition per term. The explanation of citation share is the same whether you meet it on a dashboard or in the sidebar, so different pages can't quietly imply different meanings.
- Definitions in plain English. The wording avoids circular jargon; a metric isn't defined using three other undefined metrics.
- No change to the underlying numbers. This update is about comprehension, not calculation. What the metrics measure hasn't changed - only how clearly the product explains it.
Tooltips are on by default and appear on hover, so nothing needs enabling and nothing takes up permanent space in the interface.
Which terms are covered
Coverage spans the AI-search vocabulary used across WriteWorks analytics, including share of voice, citation share and query fan-out, alongside the other metrics shown on analytics pages. Because definitions come from the shared glossary, terms added to analytics in future inherit the same treatment rather than needing a separate explanation.
Who this is for
Plain-language tooltips help anyone who reads or presents AI-search data. It's especially useful if you:
- Report to people outside search. When a founder, CMO or client asks what a metric means mid-meeting, the answer is one hover away rather than a follow-up email.
- Have just joined a team or account. New starters can read a dashboard on day one without waiting for a walkthrough of the terminology.
- Work across several brands or clients. Consistent definitions mean the same term travels between accounts without re-explanation.
- Build the reporting other people rely on. Shared definitions reduce the chance that two colleagues interpret the same chart differently.
Experienced practitioners benefit too. Even if you know what query fan-out means to you, having the product state its definition explicitly removes ambiguity about how WriteWorks is using the term - which matters when you're citing a figure in a board deck.
What this changes in your workflow
The practical shift is that AI-search reporting becomes self-documenting. Screen sharing a dashboard no longer needs a glossary tab alongside it, and onboarding a stakeholder into AI-search reporting becomes part of using the product rather than a separate training session.
It also lowers the cost of second-guessing. When you're deciding whether a movement in a metric warrants action, the first question is usually "what exactly does this measure?" - and that question is now answered in place, next to the number itself.
How to use plain-language tooltips
1. Open any analytics page in WriteWorks.
2. Hover the small (i) icon next to a metric name - or hover a sidebar navigation item.
3. Read the plain-language definition in the tooltip that appears.
That's the whole flow. There's no setting to switch on and no separate glossary page to navigate to.
Tips for getting more out of them
- When you're presenting, hover the metric as you introduce it. It gives stakeholders the definition and the number in the same breath.
- Point new team members at a live dashboard and ask them to hover their way through it before their first reporting call.
- If a tooltip's definition differs from how your team has been using a term internally, align on the product's definition - it keeps written reports and dashboard figures consistent.
Frequently asked questions
Where do the metric tooltips appear?
Tooltips appear across WriteWorks analytics pages, next to metric names as a small (i) icon, and on the more technical items in the sidebar navigation as hover hints. Because they're powered by a single shared glossary, the definition for a given metric is worded identically wherever you encounter it in the product.
Which AI-search terms are explained?
The tooltips cover the AI-search metrics used in WriteWorks analytics, including share of voice, citation share and query fan-out, plus the other metrics shown on analytics pages. Definitions are deliberately written in plain English rather than in terms of other jargon, so they make sense without prior background in AI-search measurement.
Does this change how the metrics are calculated?
No. This is a clarity improvement, not a measurement change. The tooltips explain what each existing metric measures; the metrics themselves, and the numbers you have already reported, are unaffected. Nothing needs re-baselining and no historical comparison is broken by the update.
Do the tooltips need to be enabled?
No configuration is required. Tooltips are part of the analytics interface and appear on hover, so they're available as soon as you open an analytics page. They don't occupy permanent screen space, which keeps dashboards uncluttered when you don't need a definition.
Which plans include plain-language tooltips? (confirm before publishing)
[Placeholder - availability and plan tiers to be confirmed by the WriteWorks team before publication.]
The bottom line
AI-search metrics are only useful when everyone reading them agrees on what they measure - and plain-language tooltips put that definition directly beside the number, in consistent wording, everywhere the metric appears.
If you'd like to see how much easier AI-search reporting reads when it explains itself, open any WriteWorks analytics page and hover the (i) next to a metric.